
Montipora_correction
Montipora correction
Attempts to correct artifacts in Montipora capitata developmental timeseries (3 life stages) NCBI BioProject: PRNJ738963; ENA Project PRJNA738963
The Montipora capitata developmental time series appears to contain a technical artifact inflating separation between the spat samples and other life stages. This artifact may influence cross-species comparative analyses.
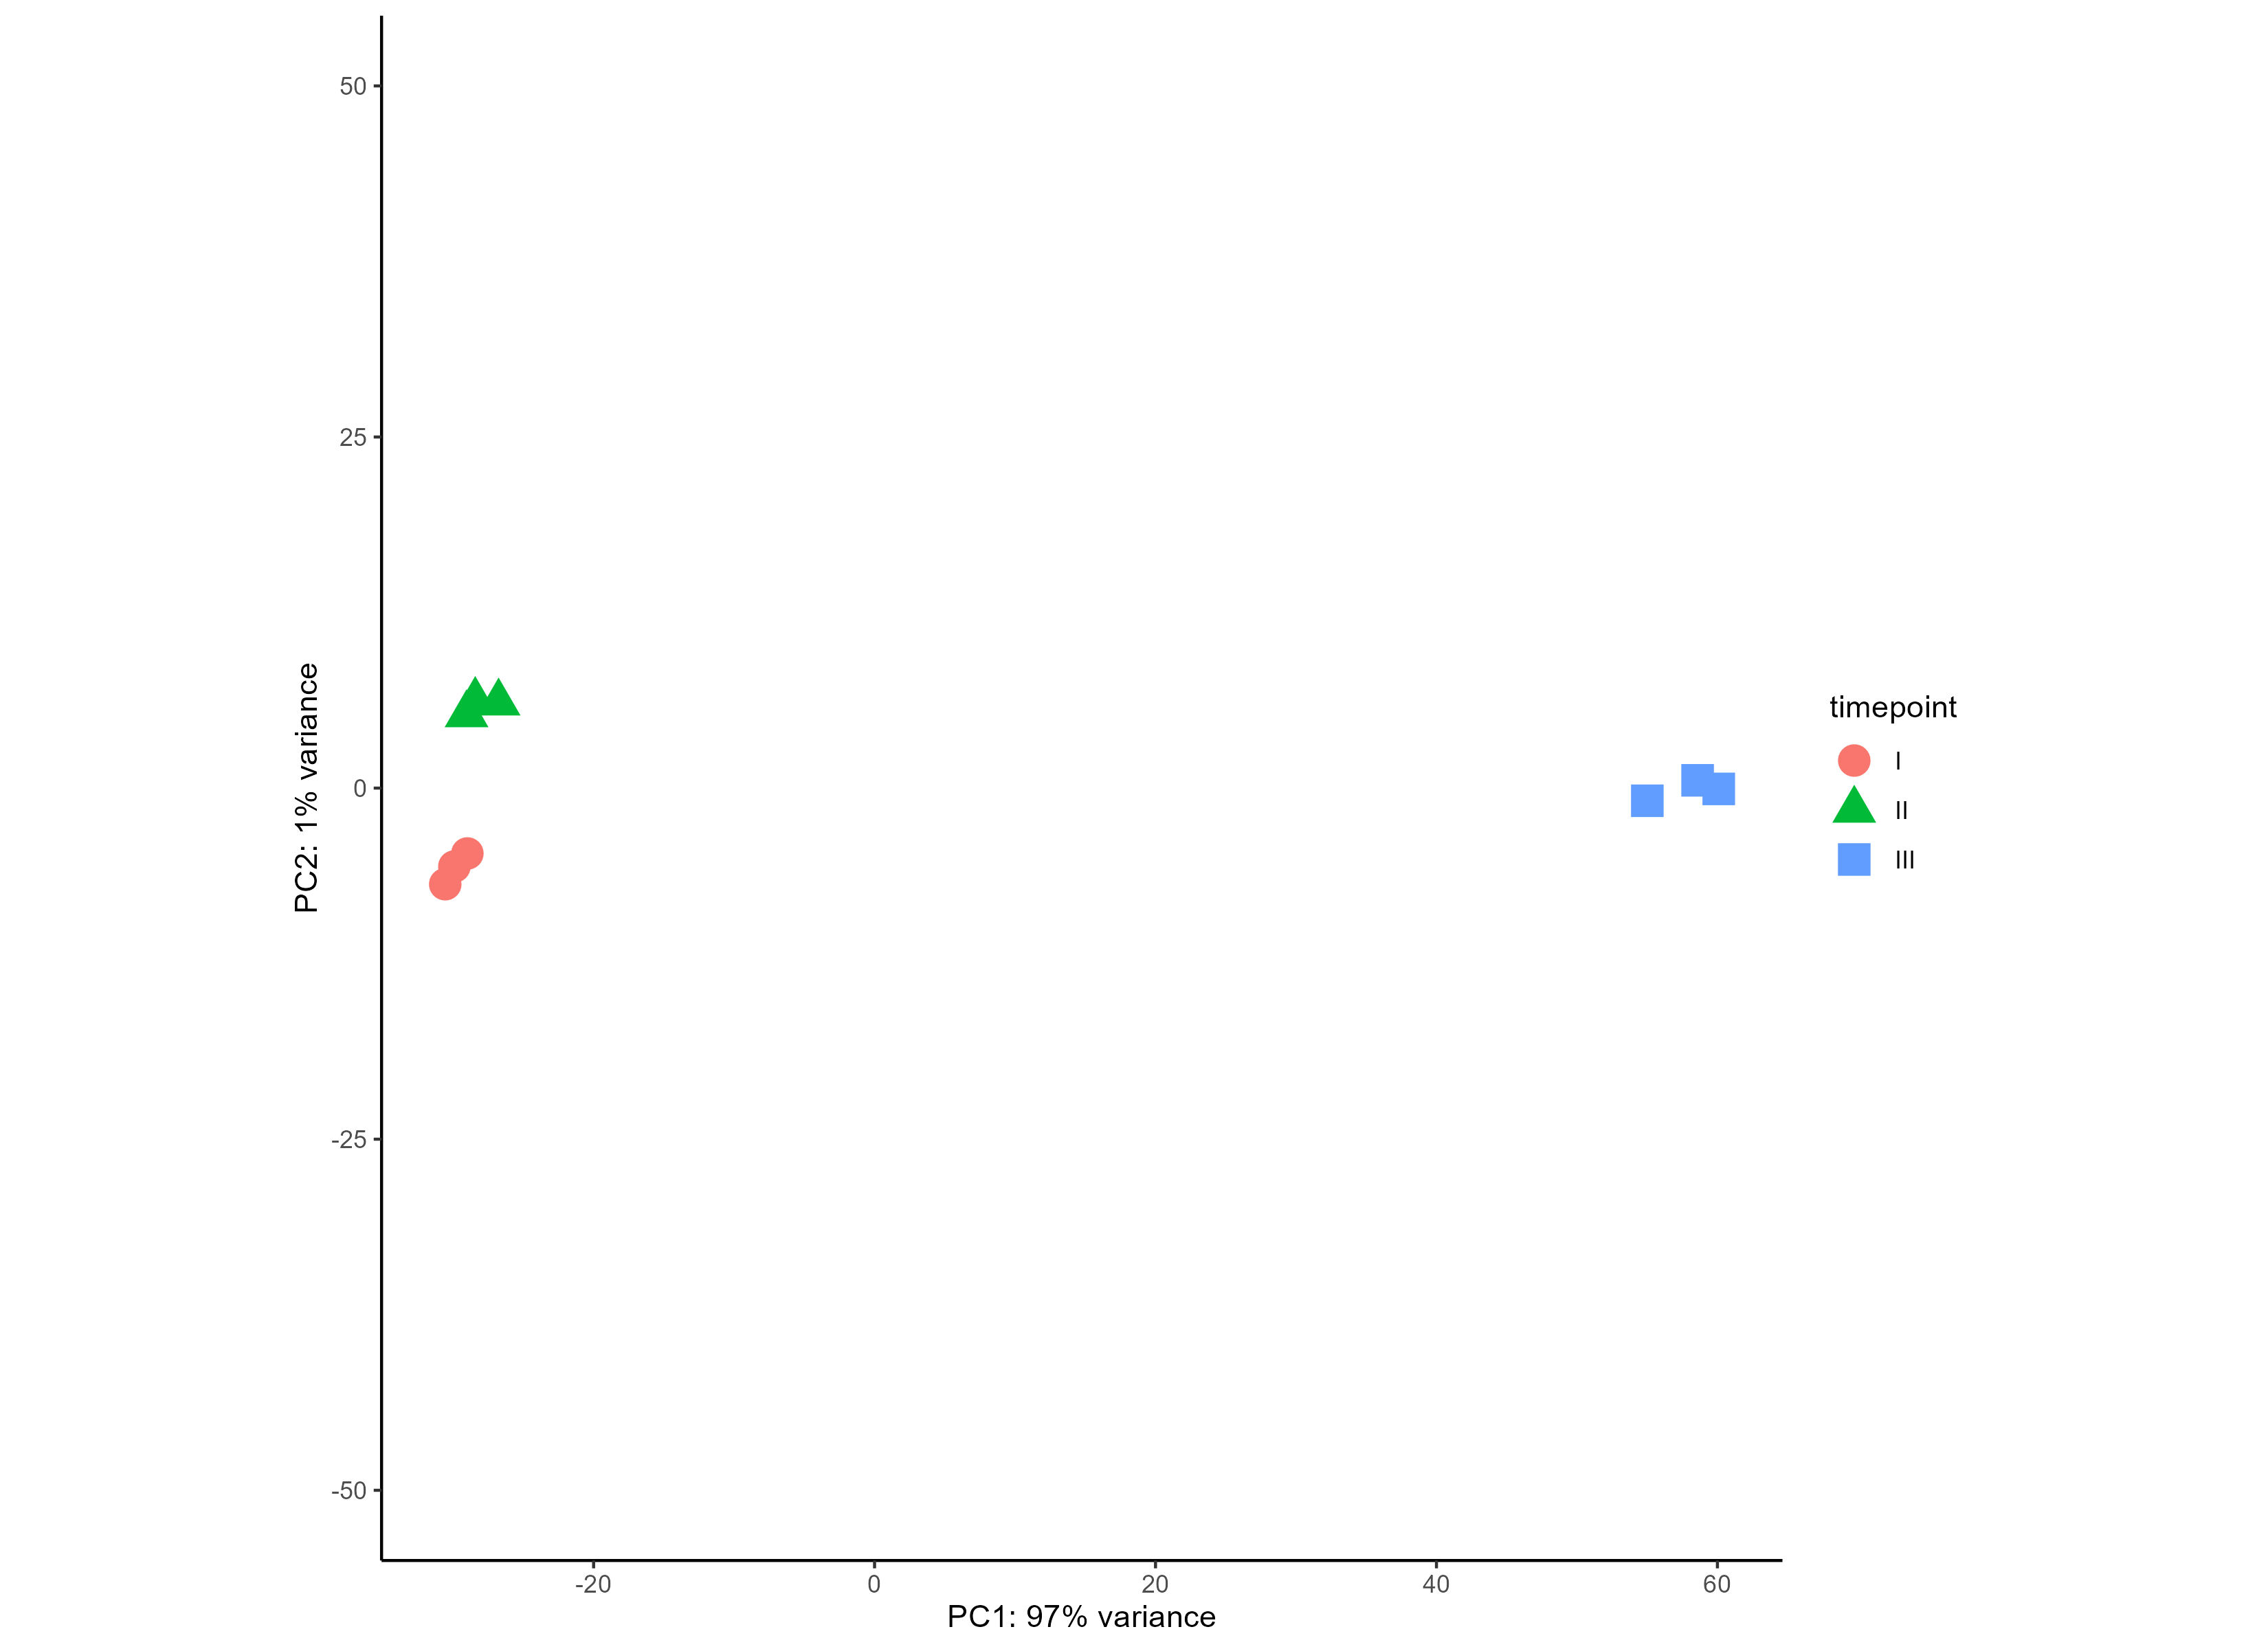
This was noticed on a PCA which was set to the ntop=1000 parameter (including 1000 top genes), where PC1 explained 97% of the variation:
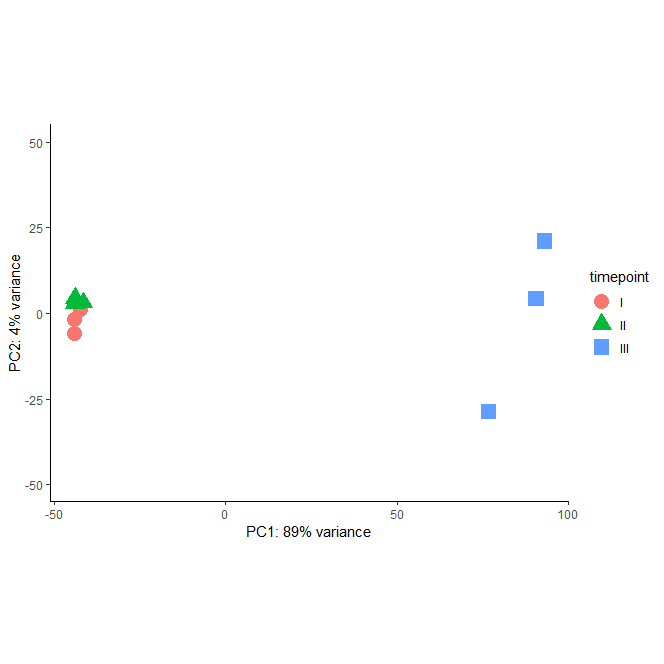
Modifying the ntop parameter to include all genes, the variance explained by PC1 is still 89%:
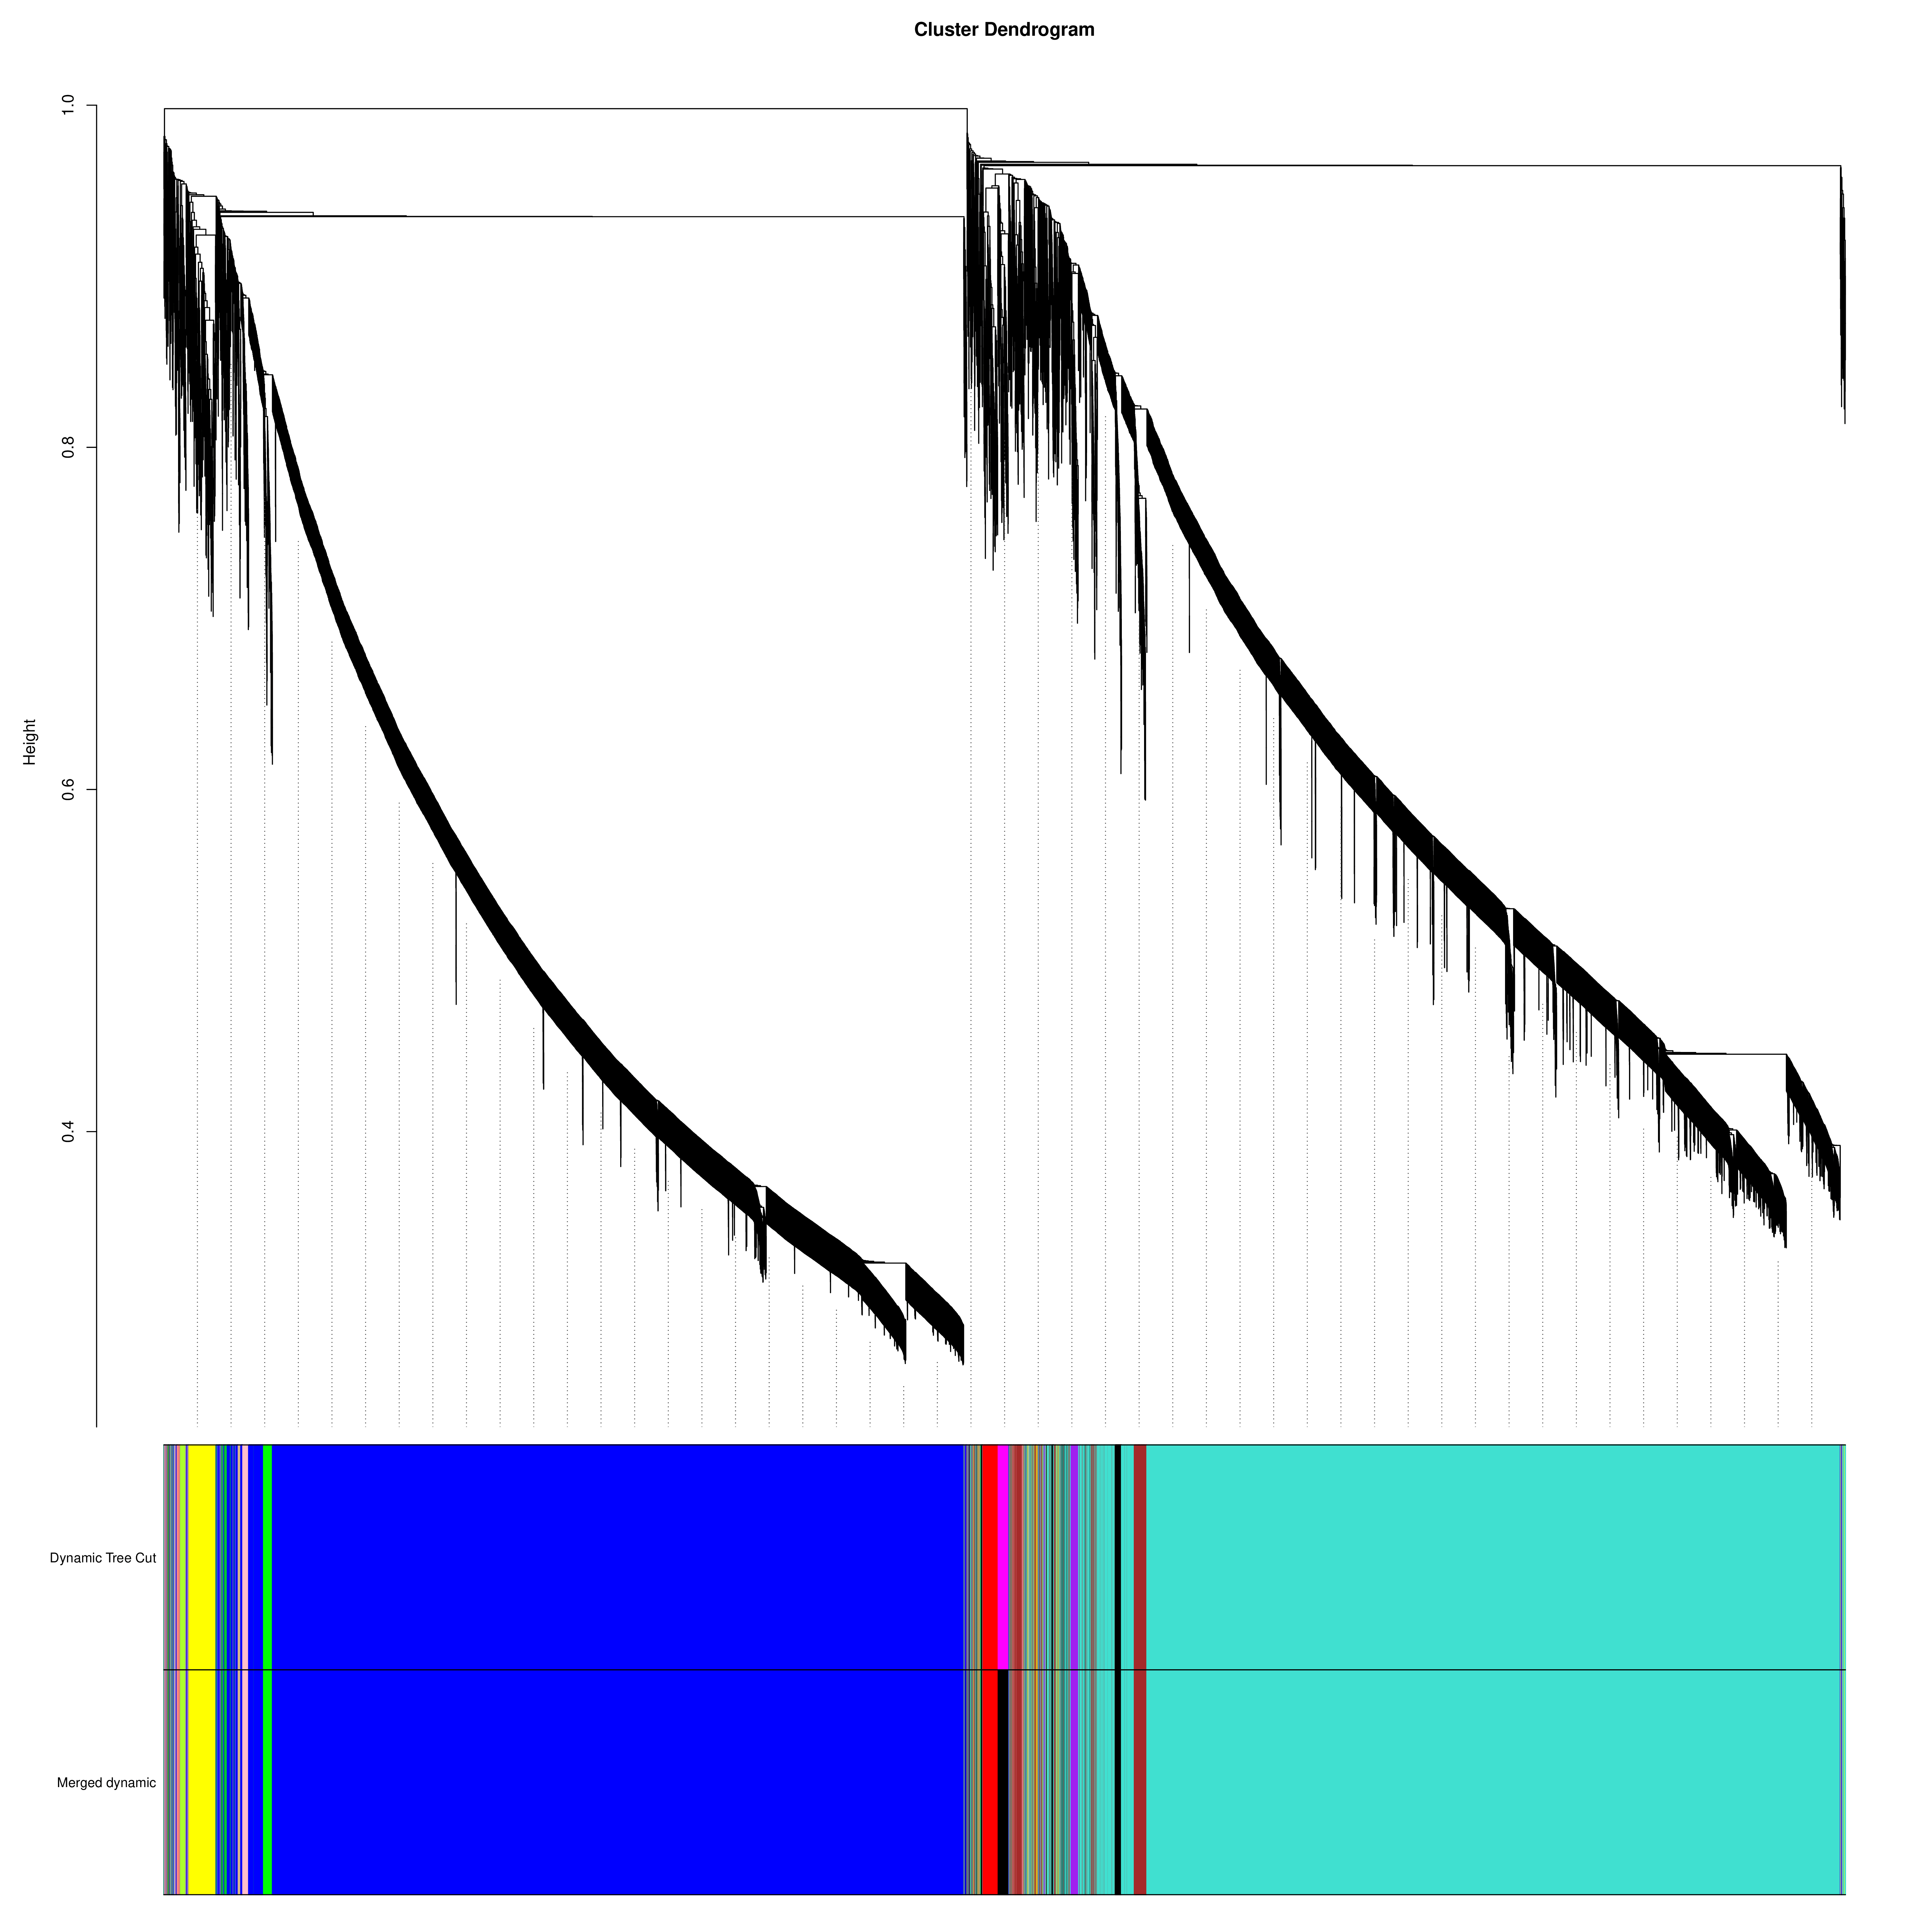
The WGCNA Topological Overlap Matrix (TOM) also shows a rare split where most genes go into the “turquoise” or “blue” modules. correlated with the larval stages cluster with “turquoise” and with spat “blue”:
Remapping and Quality Control
The original mappings were done on Andromeda (now offline), and the MultiQC reports were only on raw and cleaned reads, to get more informative statistics, I:
- I re-mapped all samples using Hive.
- I included Hisat2 logs, featureCounts summaries (only for diagnostic purposes, I had previously used the prepDE script), and computed Transcript Integrity Numbers (TINs).
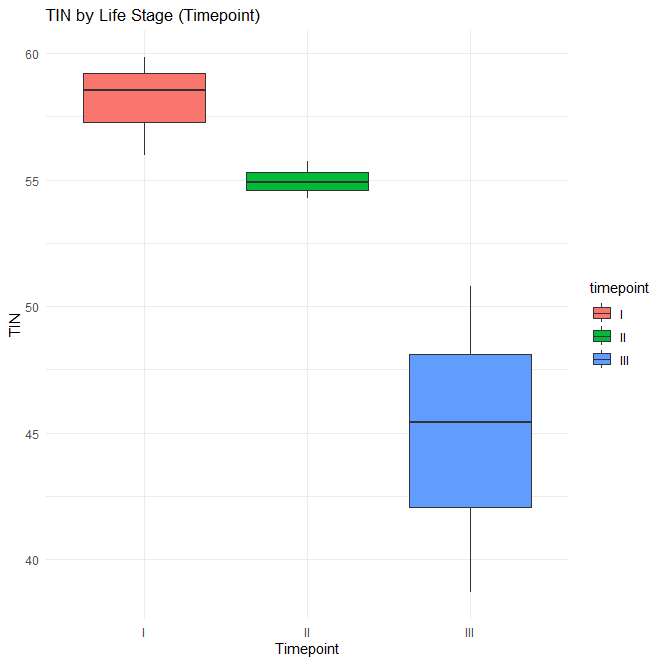
- These QC metrics showed that spat samples had lower alignment rates and TINs, suggesting RNA degradation (see tables below)
| Sample Name | Library Name | Run Accession (SRR) | TIN | Align Rate (%) |
|---|---|---|---|---|
| Mcap_Swimming_Larvae_183hpf_1 | AH1 | SRR14864072 | 59.8477 | 73.0 |
| Mcap_Swimming_Larvae_183hpf_2 | AH2 | SRR14864071 | 58.5583 | 80.8 |
| Mcap_Swimming_Larvae_183hpf_3 | AH3 | SRR14864070 | 55.9792 | 82.1 |
| Mcap_Metamorphosed_Larvae_231hpf_1 | AH4 | SRR14864069 | 55.7272 | 79.9 |
| Mcap_Metamorphosed_Larvae_231hpf_2 | AH5 | SRR14864068 | 54.2609 | 71.9 |
| Mcap_Metamorphosed_Larvae_231hpf_3 | AH6 | SRR14864067 | 54.9006 | 73.0 |
| Mcap_Recruits_5dps_1 | AH7 | SRR14864066 | 38.6921 | 47.3 |
| Mcap_Recruits_5dps_2 | AH8 | SRR14864065 | 45.4262 | 65.0 |
| Mcap_Recruits_5dps_3 | AH9 | SRR14864064 | 50.7809 | 63.4 |
| Timepoint | Mean TIN | SD TIN | Min TIN | Max TIN | n |
|---|---|---|---|---|---|
| I | 58.1 | 1.97 | 56.0 | 59.8 | 3 |
| II | 55.0 | 0.735 | 54.3 | 55.7 | 3 |
| III | 45.0 | 6.06 | 38.7 | 50.8 | 3 |
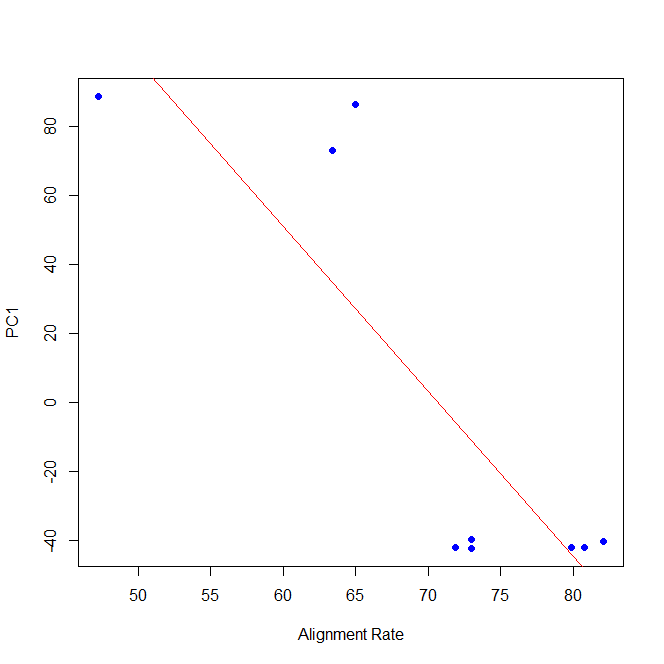
Spat samples have both lower alignment rates and TINs, but higher PC1 values (there is a strong negative correlation between PC1 and alignment rate).
Correction Strategies
To reduce the technical separation, I tested three groups of corrections and visualized results via PCA:
- Incorporating Covariates into VST
- I included covariates in the DESeq2 model used for
vst():- Alignment rate
- TINs
- Surrogate variables from
svaseq()(SVA analysis found 2 significant surrogate variables)
- I included covariates in the DESeq2 model used for
- Residualization of covariates
- I regressed out the same covariates out of the expression matrix, this created residualized matrices.
- ComBat-seq / Hypothetical Batch Adjustment
- I created a
spat_statusvariable assuming possible batch effects (e.g., different sequencing run) that could help explain the observed pattern, assuming ‘spat’ belonged to a different batch as ‘larvae’ and ‘metamorphosed’.
- I created a
Results from PCA
- VST with covariates: No dramatic change in variance explained by PC1/PC2, but spread along PC1 (range) shrank, especially with SVA.
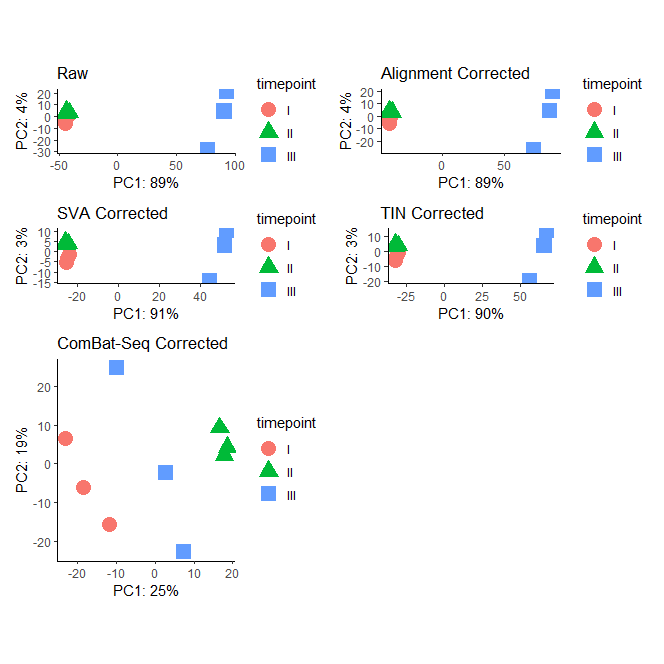
| Method | PC1 Variance (%) | PC1 Range |
|---|---|---|
| Raw | 89 | 137.0 |
| Align | 89 | 131.0 |
| SVA | 91 | 78.6 |
| TIN | 90 | 100.0 |
| ComBat | 25 | 41.6 |
- Residualized matrices: These reduced PC1 explained variance, but distorted structure:
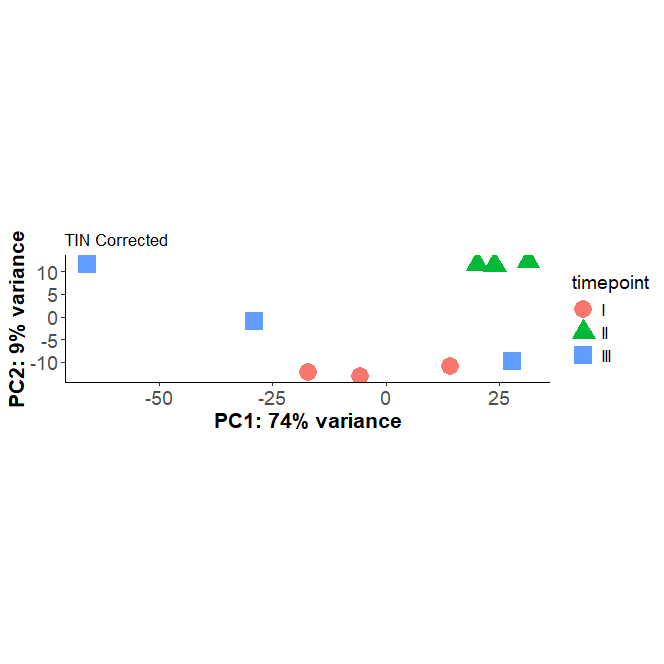
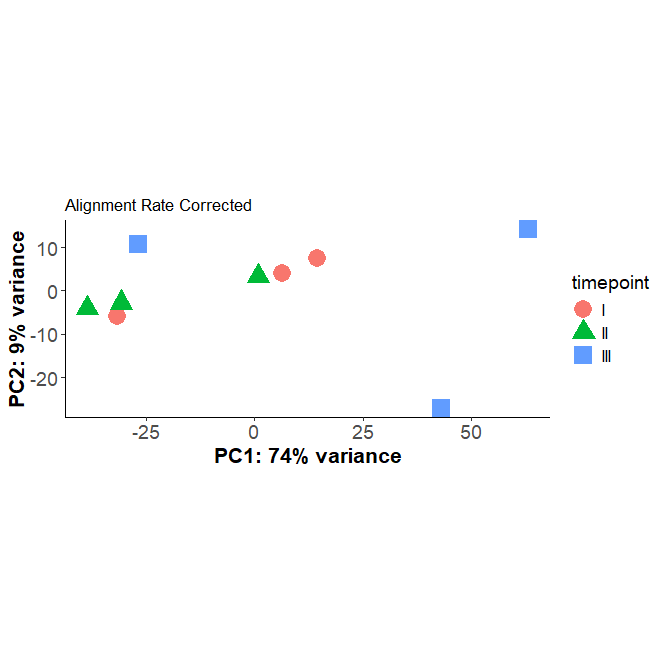
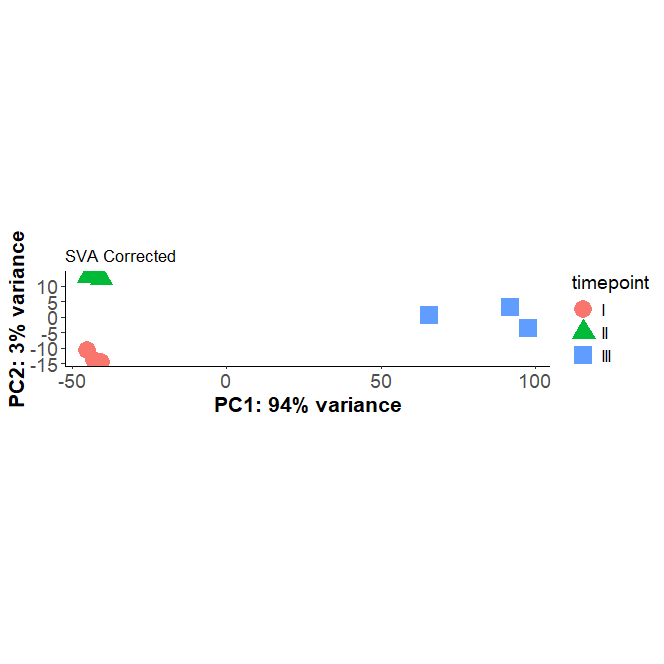
- ComBat-seq: Also introduced irregularities in global structure. (The PCA is facetted with the all corrections)
WGCNA Network Comparison
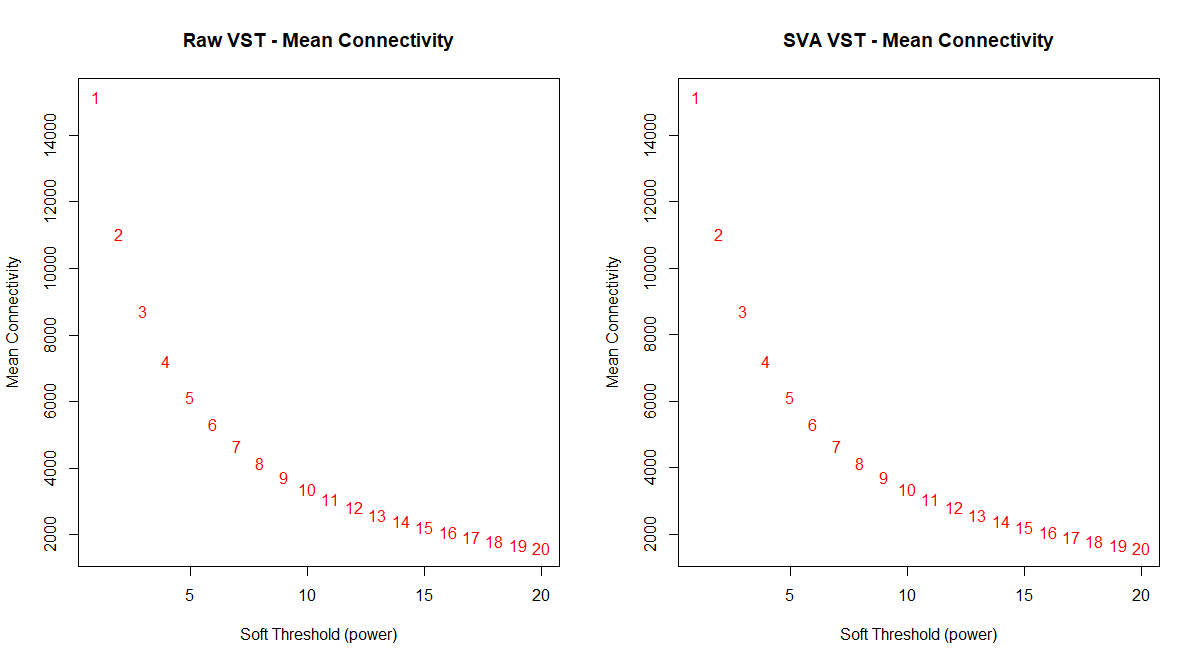
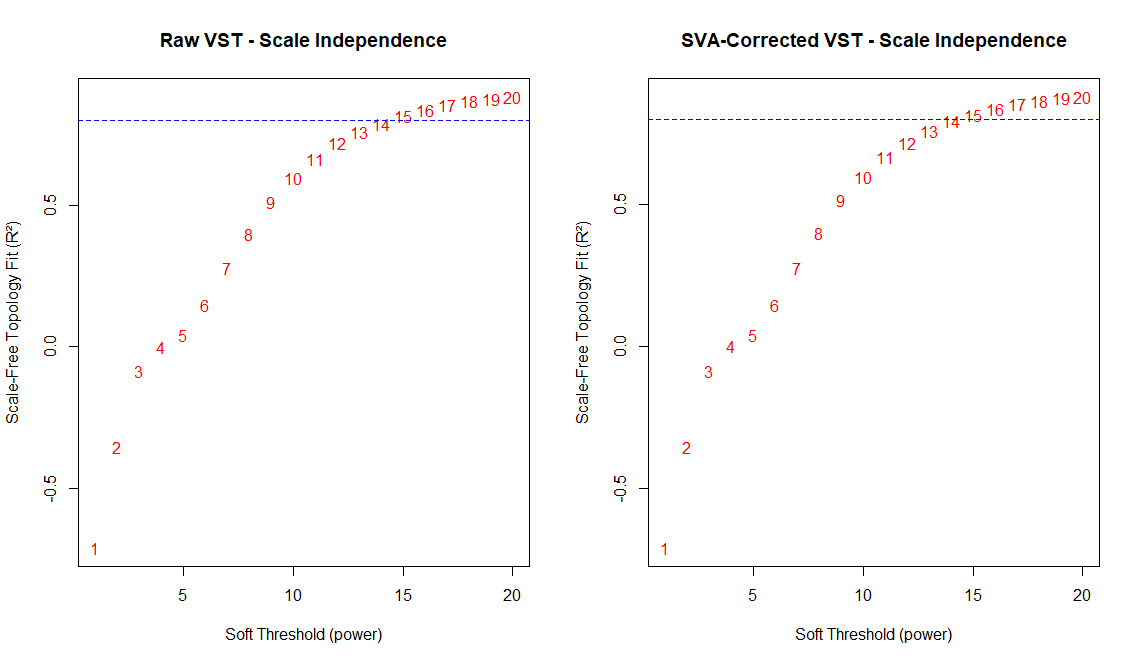
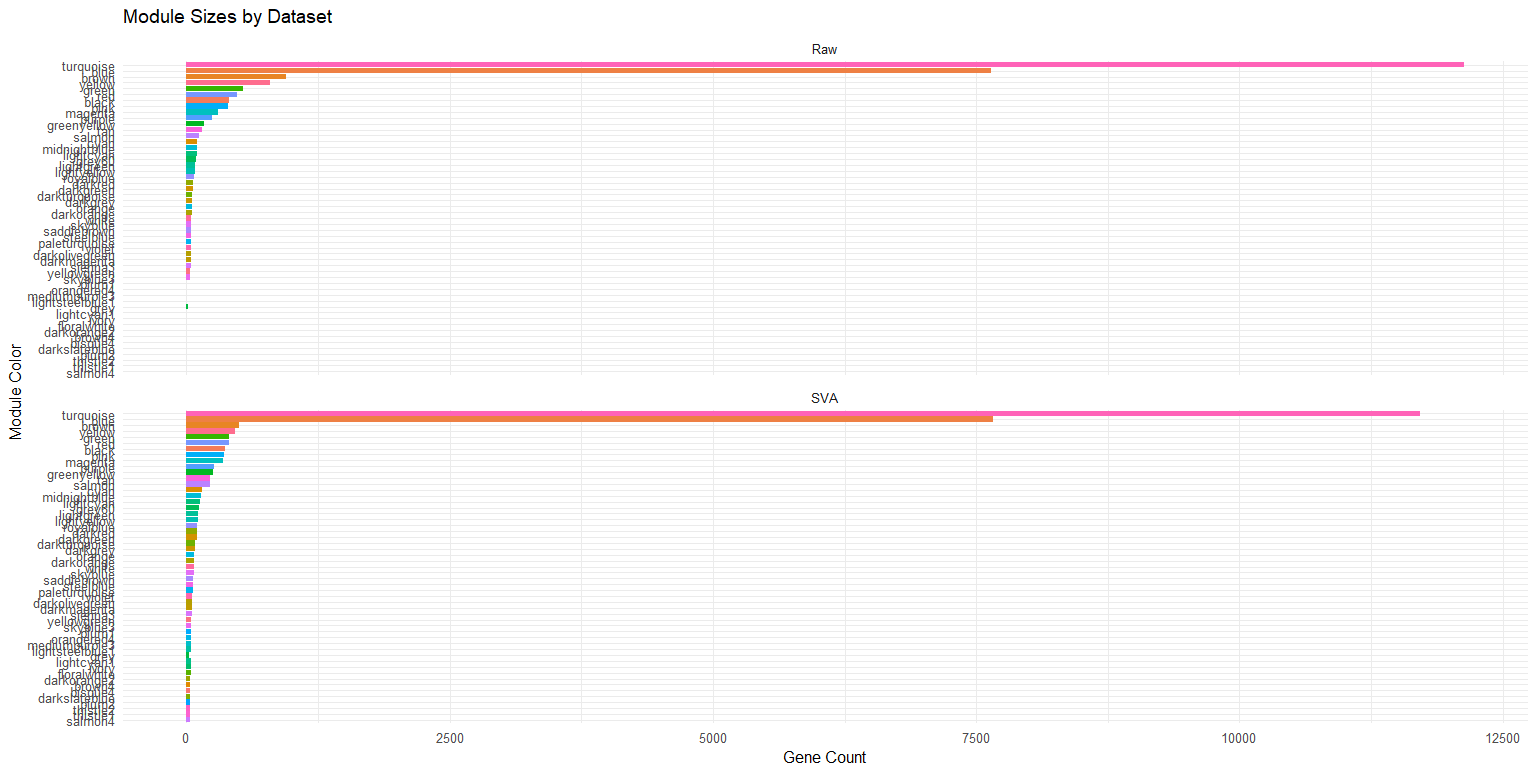
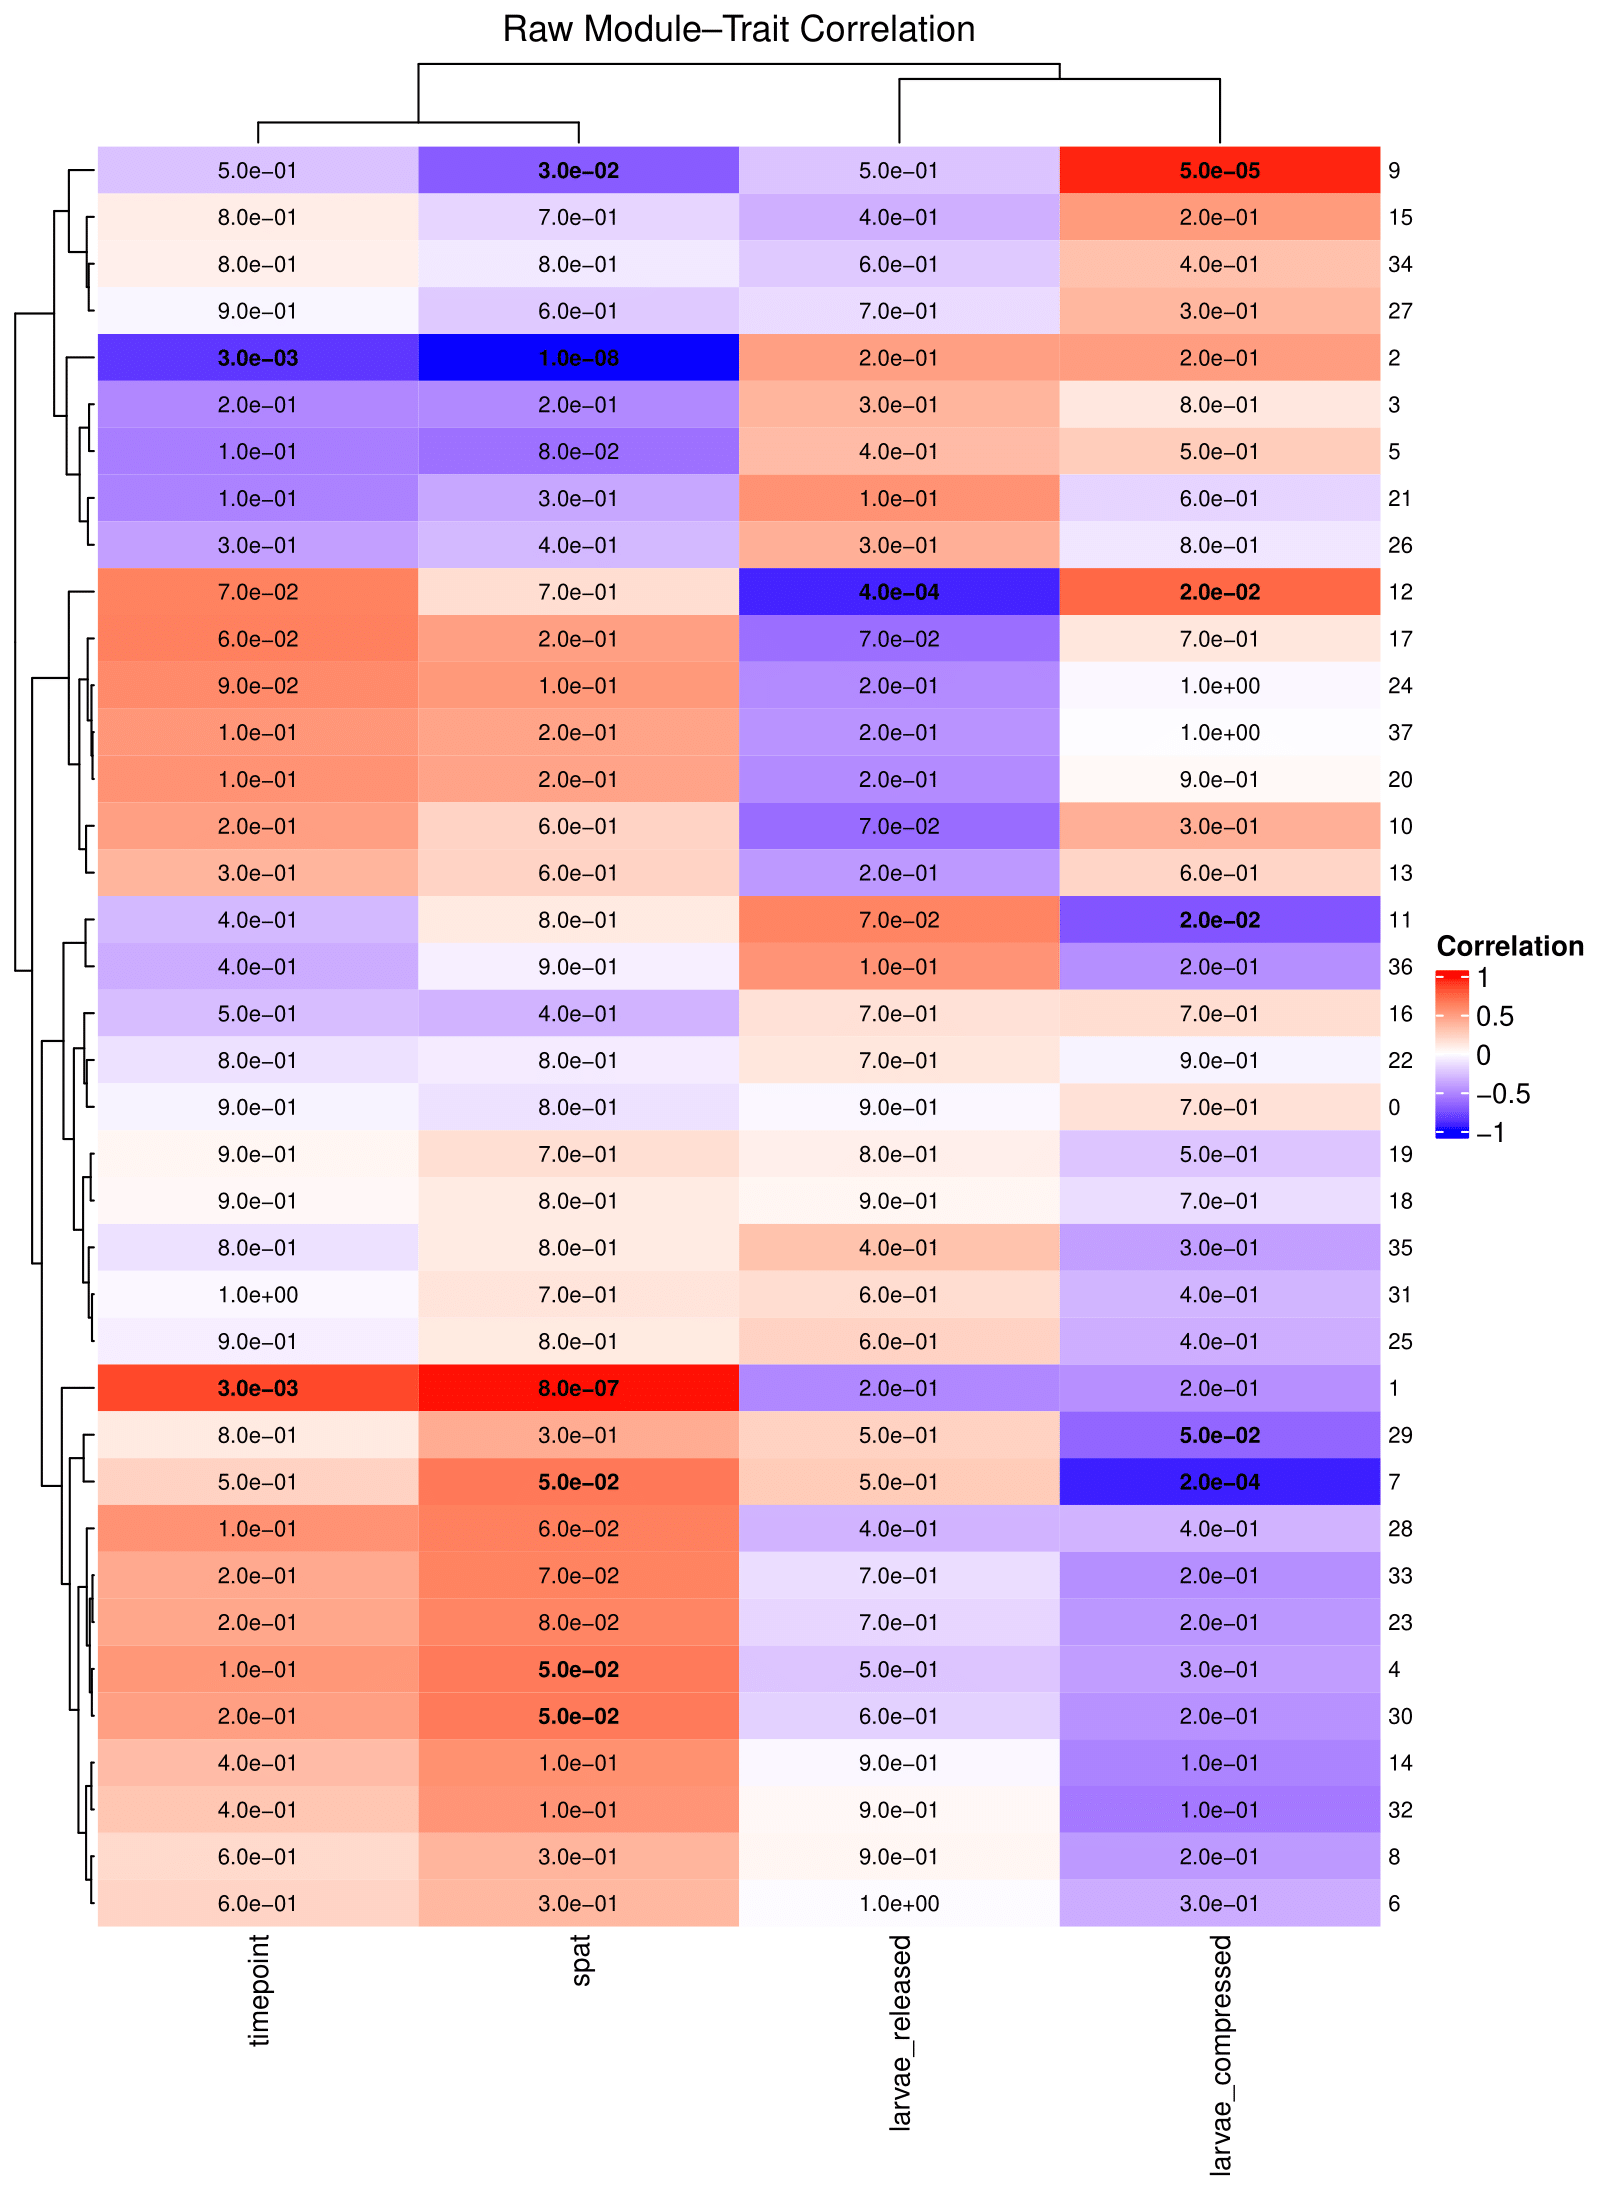
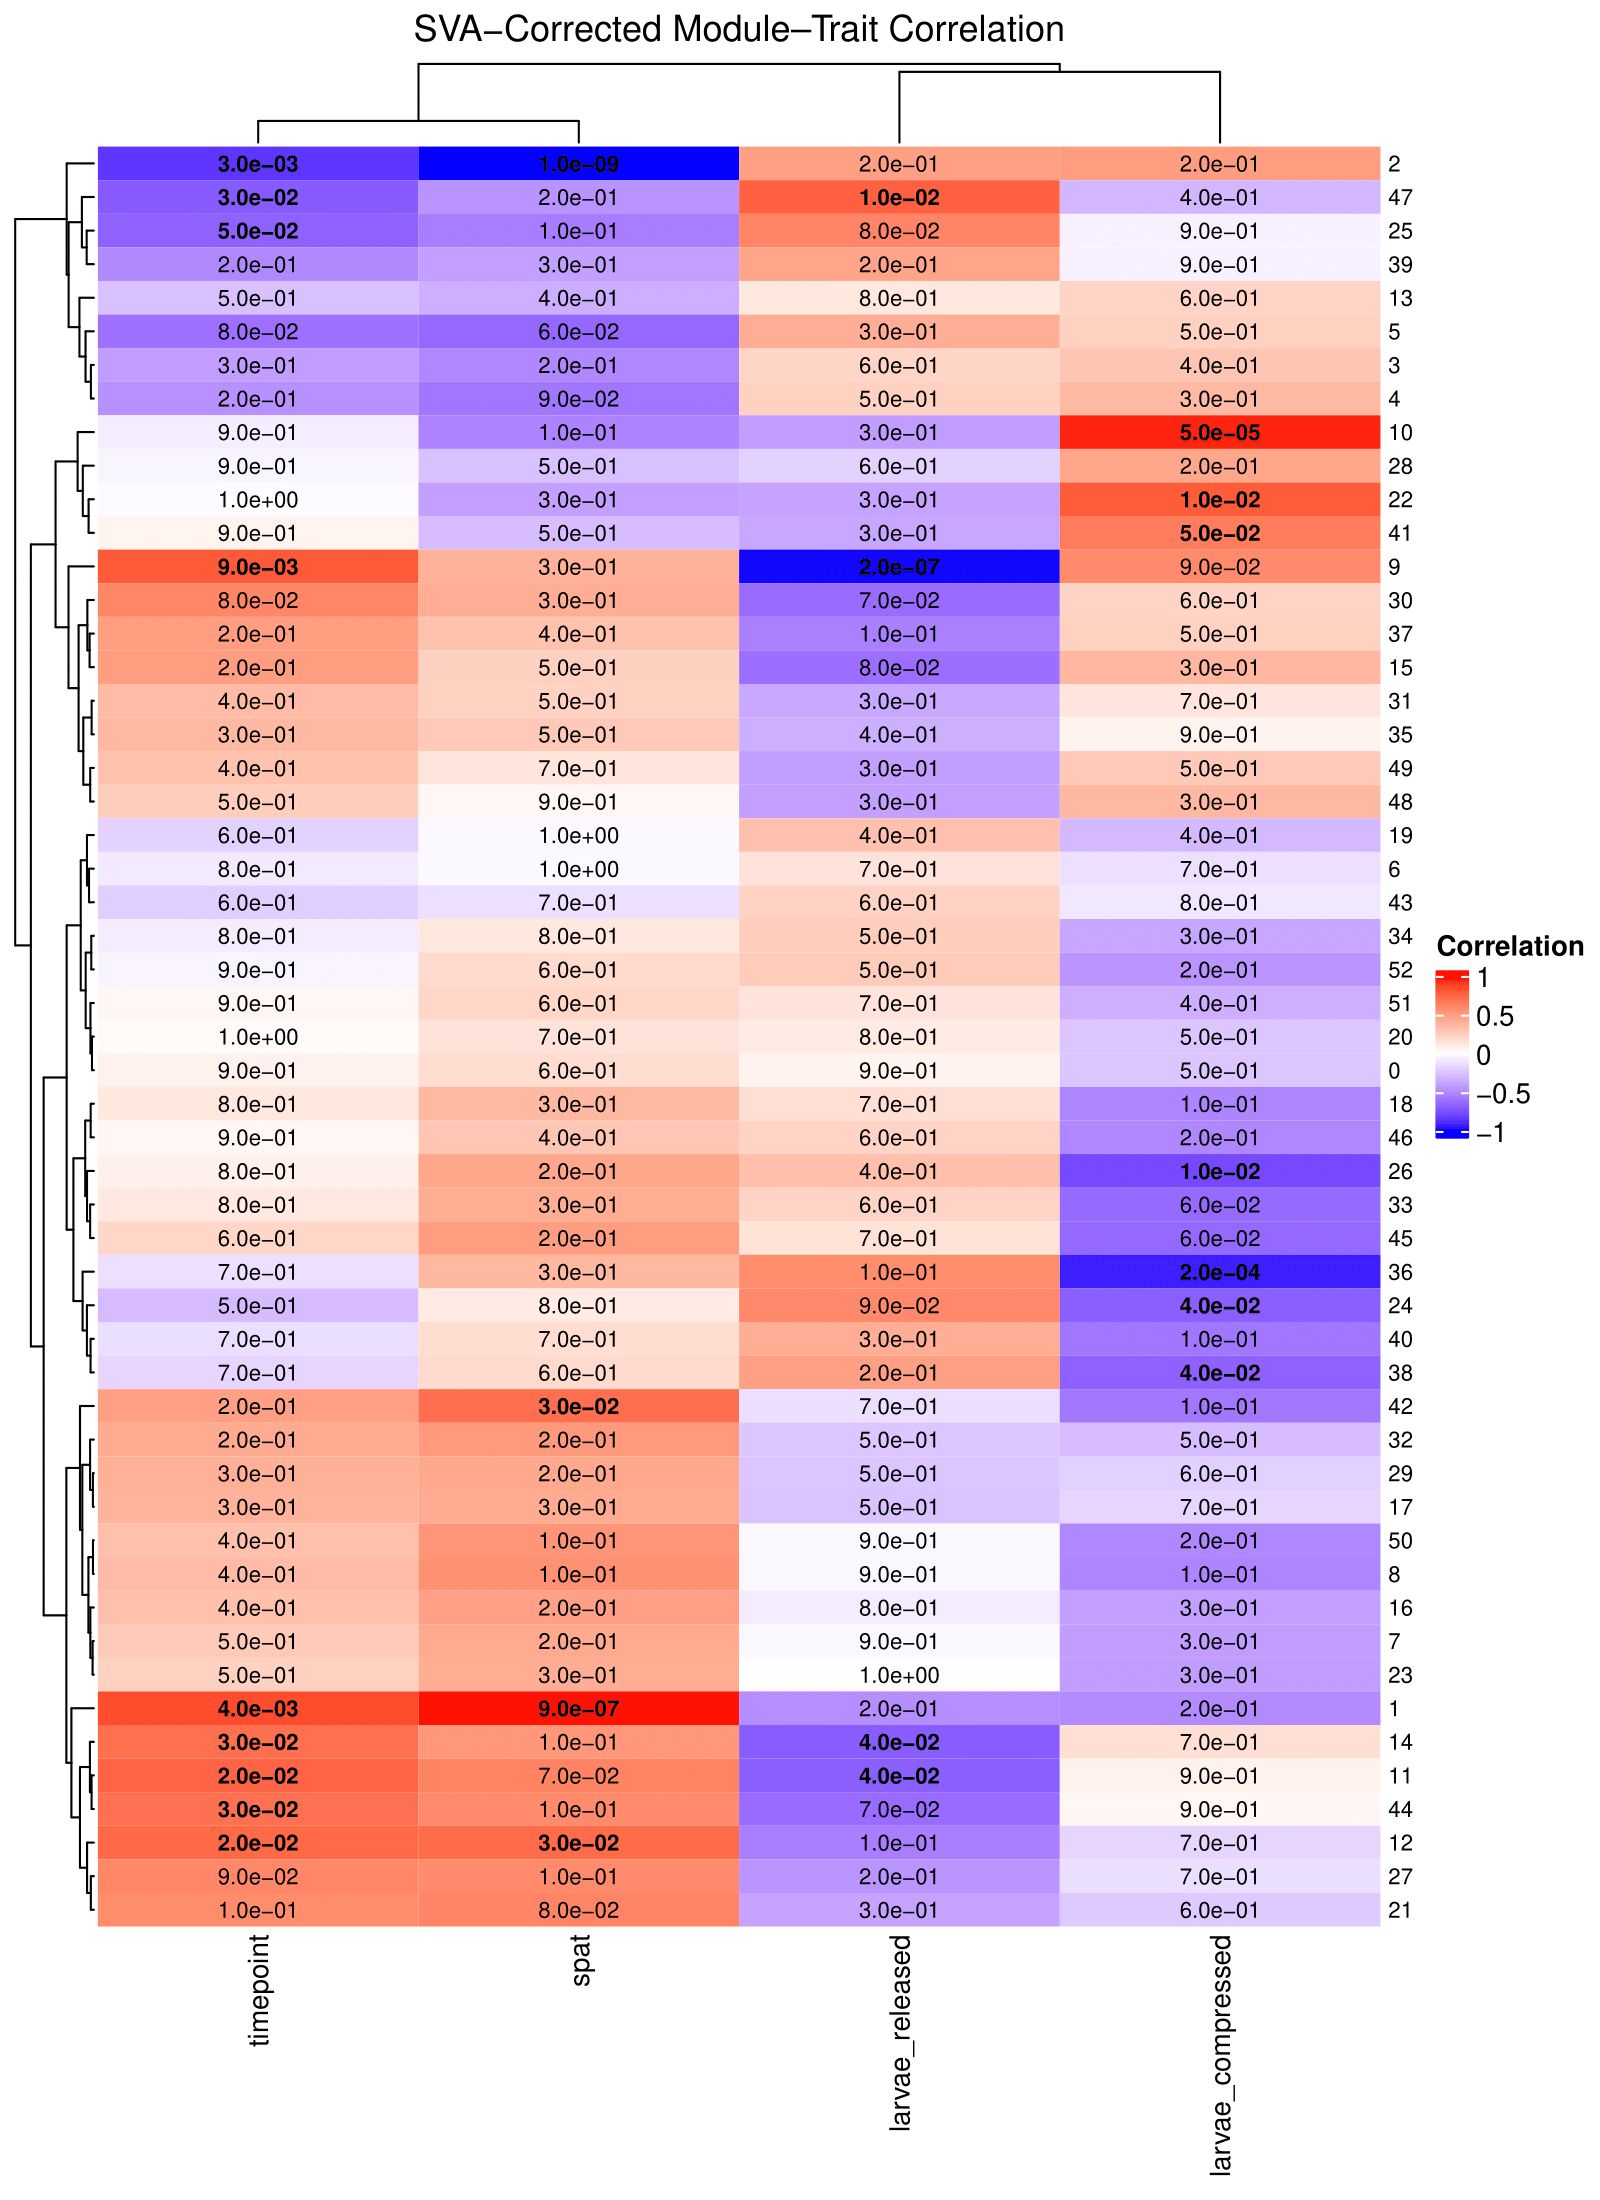
I tested whether including SVs as covariates led to changes in the network.
- I compared WGCNA networks built on:
- The uncorrected VST matrix
- The VST matrix with SVA as a covariate
- Results:
- Core network structure remained largely preserved.
- SVA correction slightly redistributed module membership (e.g., fewer genes in turquoise, more in smaller modules).
In this repository I placed relevant files for the mapping process (MultiQC reports, bioinformatics code), the WGCNA Montipora code and gene count matrix, and the attempts at corrections code with files.